A Shiny New App!
You can do so much in R! Including designing and programming your own app through the Shiny package!
Friday, Sep 11, 2020 By Hope Snyder.

Application design is a highly sought skill in the workforce, especially with so many things moving online. Even fields that are not necessarily technologically driven also can benefit from having an application that makes it easy to explore the related data. Luckily, like most things you may want to do with R, there is a package for that! Shiny contains a collection of functions that help you design an interactive web application. What kinds of apps can you build with Shiny? Your imagination is the limit!
Getting the Ingredients
The first thing you need to get working with Shiny is the shiny package. You can install this by running the function install.packages('shiny'). Once it finishes installing, you should be ready to start creating your application. You have a few options for how you want to set up the files for your application (See below for more details). I recommend making a folder or R project named after your app, so everything you need for the application will be in one place. You won’t have to worry as much about figuring out the system paths so that the files are able to communicate with each other.
Before starting with your first app, there are a few other packages that you might be interested in. These extra packages add more features to Shiny and improve the look of your application. This list is not exhaustive, but it is things that I have found useful.
shinyalert: creates pop-up messages within the app, such as information blurbs or error messagesshinythemes: adds some theming to applications, also includes a theme selector for testing purposesshinyjs: adds functions to improve user experience by using some Java Script. -shinyWidgets: updates many of the input panels to a more modern look (I just discovered this one and can’t wait to use it!)
Pieces of the Pie
Now that you have Shiny installed, the next question is what sort of files do I need to make and what do those files look like? What pieces make up this pie? For Shiny applications, there are only three main files that you need to make. Each makes a specific piece of the application. There is also the option to include these three pieces in one file. However, for complicated applications you will want to break up the pieces into separate files so that you don’t end up with a file that is thousands of lines of code.

Global
The global.R file is where you put all of the static objects that your application needs in order to run. For example, the code needed to read in the data for the app should go here. Also, all of the packages that your app uses can be loaded in the global file. If you aren’t sure what to put here, think about what parts of your app are not reactive and can be calculated at the time the app opens.
library(shiny)
library(shinythemes)
library(shinyalert)

data <- faithful
User Interface
In the ui.R file you set up how the app looks to the user. You can also designate place for the user to interact with. The way Shiny organizes the application layout is through panels. Inside the Panels, you can place widgets for input from the user and the reactive output that follows. These panels and layout functions are nested within each other to create the layout of your app. As with most things in R, it is completely customizable. Some common layout functions that are used are as follows:
fluidPage(): allows the web page layout to adjust as needed depending on the size of the website windowsidebarLayout(): formats the overall layout that includes two panels, sidebar and main. Usually, the sidebar is for input widgets and the main panel holds the output.titlePanel(): where to put the title of the applicationwellPanel(): creates a panel that has background shading
Each input widget gets it’s own name to keep track of the information there. The functions for the input widgets have the form *Input(inputID= "name", label = "Instructions for using the widget."), where the * is the type of widget you want to use. The reactive panels follow a similar format except using the word “Output” in the function names. The output panels correspond to a render function in the server for the app. An example of the user interface file is below.
shinyUI(
  fluidPage(
    titlePanel("Hello World!"),
    sidebarLayout(
      sidebarPanel(
        # Input: Slider for the number of bins
        sliderInput(inputId = "bins",
                    label = "Number of bins:",
                    min = 5,
                    max = 50,
                    value = 30)

      ),

      mainPanel(
        # Output: Histogram
        plotOutput(outputId = "distPlot")
      )
    )
  )
)
There are so many options for widgets and output panels. A full list can be found in this cheat sheet.
Server
The last piece of the application is server.R. Here you take the input from the user and create output. It’s everything that needs to happen behind the scenes in your app. It’s where all the reactivity comes in to your app. The user gives the app a value through the UI and the server takes that information and runs it through whatever R code you write to create the output.
The server itself is actually a function of this input and output. Consider those to be vectors holding all of that information. Because they are vectors, when they are referenced in the code you need to use vector notation: input$name. The result of the function is the redefined output vector.
The code for processing the input information is contained within a render*() function, where the * corresponds to the type of output that will be produced. It should match the output function used to display the final product of the code in the user interface. The sort of code that you can include in the render functions is only limited by what you can do in R. Just about anything is possible!
shinyServer(function(input, output) {
# Histogram of the Old Faithful Geyser Data
# with requested number of bin automatically
# re-executed when input$bins changes
output$distPlot <- renderPlot({
x <- faithful$waiting
bins <- seq(min(x), max(x), length.out = input$bins + 1)
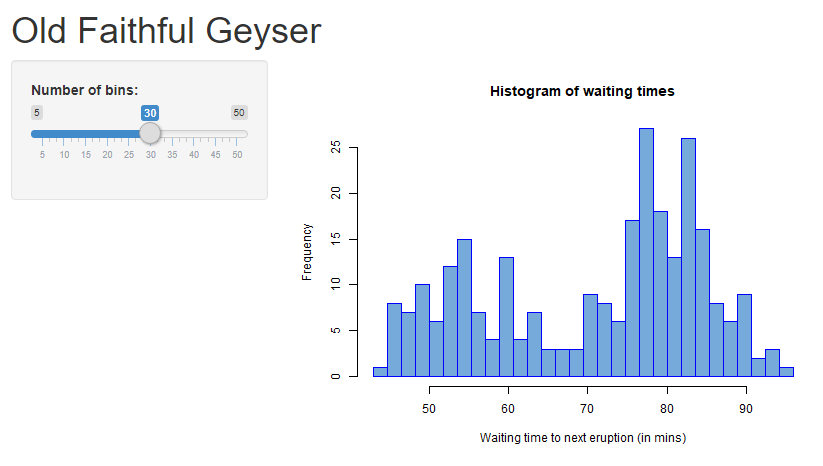
hist(x, breaks = bins, col = "#75AADB", border = "blue",
xlab = "Waiting time to next eruption (in mins)",
main = "Histogram of waiting times")
})
})Now that your app is written, you need to run the app and make sure the application behaves the way you want it to. To do this, use the function runApp("directory_app_is_in"). There is also a button in RStudio at the top of the text editor window. Your app should appear in the viewing pane for you to test.
(You may wonder why this app isn’t interactive. There are a few adjustments that need to be made to embed a Shiny app into a blogdown page. Keep your eyes out for a future post!)
Time for a Taste Test
Now that you have created an app for people to learn and discover trends in your data themselves, you need a way for those individuals to access your application. There are a number of different sharing platforms. RStudio provides their own hosting platforms for sharing among multiple computers:
Or you can host it on your own servers. The nice thing about each of these services is that they offer free versions with a few restrictions on how much you can publish to them. For example, shinyapps.io allows for up to 5 applications to be published for free. RStudio Connect also allows for other R created content to be shared, like Rmarkdown documents and presentation slides.
I hope this has been a decent introduction to applications through Shiny. There is still so much to discover about them, if you are so curious. If you want more detail about creating a Shiny app, I recommend this book by Hadley Wickham. There are also annual contests for Shiny applications hosted by RStudio. Find out more information here.