The Heart of R: Functions
What makes R great is the functions. But what are they?
Friday, Sep 25, 2020 By Hope Snyder.
The way you do almost anything in R is through functions. Functions are like casting spells. You want to make an object float, but in order to do that there are certain steps you need to take and information you need to give for the spell to be cast successfully. Things like the incantation(name), burning of certain herbs (input information), and completing certain tasks (computations). Once you have all the pieces set up, spells or functions work smoothly (90% of the time). Functions are used all the time, so you have definitely used them before in your code. The next challenge is to create your own!

Defining Spells(Functions)
You can think of functions like mini programs. You give them information and they calculate a result exactly like a program. To be specific with the definition, a function is a set of statements organized together to perform a certain task. Most people think of functions as \(y=mx+b\) from algebra. This form is recreated in R.
There are four basic parts to an R function:
- Name:
slope <- function(){}What you call the function and it’s something that R can remember the mini program by. Note that for R to realize it is a function, you must state that it will be a function. - Input:
slope <- function(X, Y, B){}The information that the user needs to provide for the function to run. - Computation:
slope <- function(X, Y, B){(Y-B)/X}The calculations that will be done each time you call the function. - Output: The result of the function that is given after the computation.
slope <- function(X, Y, B){
  M = (Y-B)/X

  print(paste("The slope is equal to ", M))
}
Simple Spell Demonstration
Above, we created a function for finding the slope of a line using a single point and the intercept. The process is the same for every function that you create. Sometimes it might be easier to define the computations first. Then that will give you a clear indication of what is needed as input from the user.
Using the function is as simple as calling the name of the function and giving the neccessary input information.
slope <- function(X, Y, B){
  M = (Y-B)/X

  print(paste("The slope is equal to ", M))
}

slope(2,5,7)
## [1] "The slope is equal to -1"Now that we have functions that work and know how to create new functions, the remaining question is “When?” When should you create functions to use in your code? The quick and easy answer is when ever you want! You can create a function to do almost anything, so if you want the practice with writing functions, go ahead! There is nothing stopping you!
The long answer to the question has a three parts:
- When your code repeats a lot and you only change one or two things each time you copy and paste. That is a perfect indicator that you should write a function.
- When it is something you want to use in the future. For example, you read in data from a specific program, then you can create a function to make it easier for you the next time. Just
source()the file that hold all of your home brewed functions. - When you are writing a package, even if it is just for personal use. Packages are collections of functions. Without writing the functions, the package does not fully exist.
Spell Level 2 Demonstration
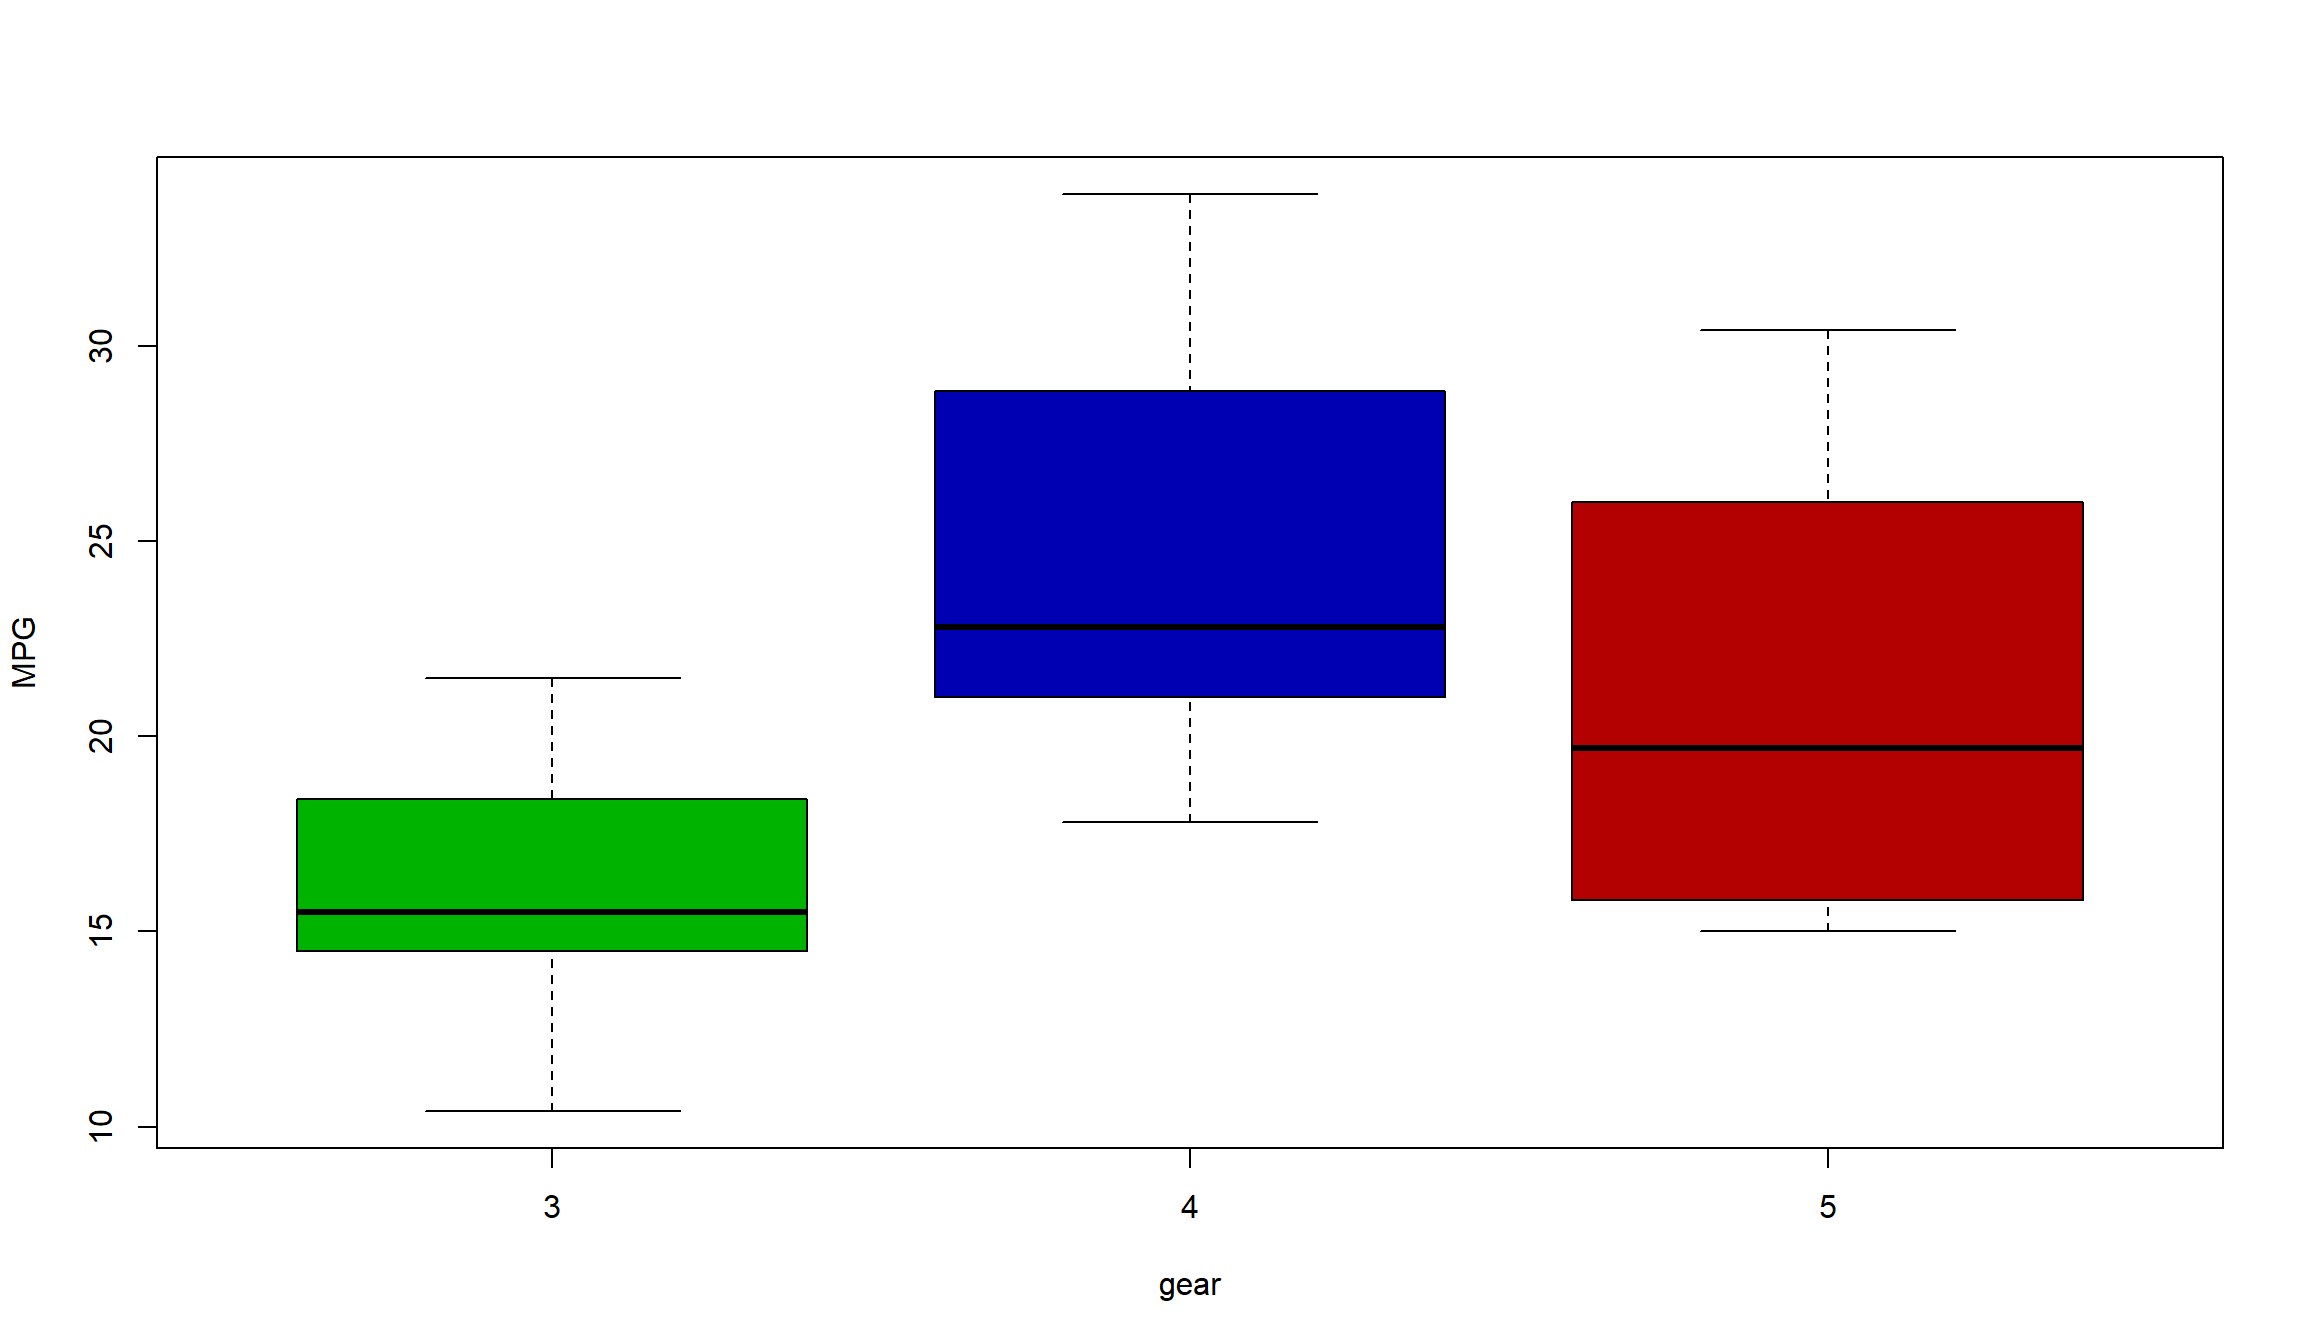
For a slightly more advanced function, this example nests one function within another. First, I create a function that will pick out a specific number of colors. These colors will be based on how many unique entries there are in a data vector. The second function then will call this function and use the results to create a collection of box plots each with their own color.
pick_a_color <- function(x){
  I=length(unique(x))
  myColor=hsv((1:I)/I,1,.7,1)
  return(myColor) #the return command is used when you want only specific results returned from your function.
}

My_plot=function(x,y,...){
  color = pick_a_color(x)

  boxplot(y~x,col=color,... )
}
I will demonstrate the results of my plotting function using data from a built in dataset called mtcars. This data set comes with base R so you should be able to use this function as well.
dat <- mtcars

My_plot(dat$gear,dat$mpg,xlab="gear", ylab="MPG")